Financial Modeling in today’s evolving business world is crucial, and Excel plays an essential role in this process. It helps businesses create dynamic models, providing a clear roadmap for decision-making, Peter Drucker has rightly said, “What gets measured gets managed.” Financial Modeling enables businesses to measure and manage their financial performance effectively. This active approach to financial modeling empowers organizations to navigate uncertainties plan for the future and maximize their financial success. In this article, you will learn the best practices for financial modeling in Excel.

By leveraging Excel’s functionalities, businesses can create dynamic models that help them understand the potential impact of various scenarios, optimize resource allocation, and confidently make strategic decisions.
What is Financial Modeling?
Financial modeling is creating a mathematical representation of a company’s financial situation. It involves using spreadsheets and other tools to project future performance, assess risks, and make informed decisions about investments, budgeting, and strategic planning.
What are the best practices for financial modeling in Excel?
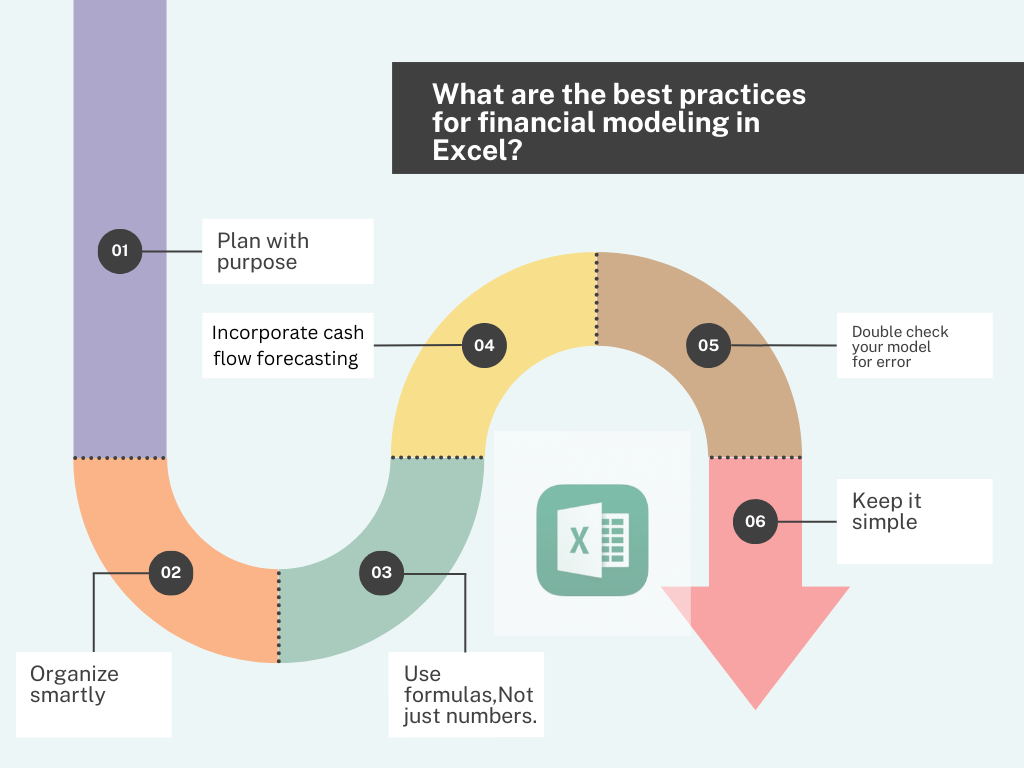
Financial modeling in Excel is a powerful tool, that businesses use to enhance their forecasting capabilities. To ensure accuracy and efficiency, follow these best practices:

1. Plan with purpose:
- Think of specific money challenges you want to solve.
- Who will use your model?
- How you’ll use the model.
- Outline the numbers you’ll put in (input), the process, and what you want to get out (output).
- A clear plan helps you manage your money well and plan for the future.
2. Organize Smartly:
When creating your financial model, split it into three parts:
- Calculations: Figure out what happens based on your predictions.
- Assumptions: These are your money predictions
- Outputs: Show how well your business is doing.
- Keeping things organized makes it easier for others to understand.
3. Use Formulas, Not just numbers:
- Using formulas is better it helps others understand complex figures.
- Avoid guessing numbers.
- Explain your ideas clearly
- People trust your data more if they know where it comes from.
- You will create financial models that are effective and easy for everyone to understand if you follow these steps.
4. Incorporate cash flow forecasting and balance sheets into your financial model:
Ensure your plan includes balance sheets, cash flow calculations, income statement-crucial documents that provide a comprehensive financial picture. For planning your business, follow these things:
- Value-based pricing
- Tier pricing
- Stock turnover
- Private Equity
- Debt historical data
- Creditor dates.
- Always include these elements in your financial plan for effective money management.
5. Double-check your model for errors:
Conduct a thorough review to guarantee accuracy and consistency in your company’s financial performance. Perform a “sanity” check to ensure that your model not only looks good on paper but also aligns with real-world situations.
6. Keep it simple:
Financial models work best if they’re easy to understand. Follow these t
Do’s
- Use clear money predictions.
- Keep formulas simple.
- Limit the use of special names for cell
Don’t
- Use different formulas row by row
- Mix up formatting styles
- Forget an executive summary. If an Excel formula is confusing, break it into smaller pieces. Use tools like flags and data validation to simplify.
How do you format financial models in Excel?
Are you wondering how to structure your financial model in Excel for optimal clarity and usability? Let’s see what is the best practices for financial modeling in Excel, that can help you create an effective and user-friendly financial model.

Financial modeling best practices in Excel, and organization are key. Begin by structuring your workbook into logical sections, dedicating separate sheets to the Income statements, Balance sheets, and cash flow statements. This approach enhances the model’s navigability and keeps information neatly organized.
Transparency is crucial in financial modeling. Clearly outline your assumptions on a designed sheet. This helps users understand the basis for your calculations and allows for easy updates as needed.
Formatting is an essential element. Ensure uniformity in how numbers are presented in the model. Always use colour-coding or bold fonts to highlight key figures, providing visual clarity and making it easier to interpret the information.
Harness the power of, what is the best practice for using financial modeling in Excel by using formulas to streamline calculations. Implement functions for common financial computations and link cells accurately to maintain precision. This saves time and minimizes the risk of errors.
Documentation is your ally in maintaining transparency. Include a detailed documentation sheet explaining the models’s purpose, assumption and methodology. This serves as a valuable guide for users and provides insight into reviews or modifications.
Regular validation and auditing are the final touches. Cross-reference your model’s results with external data and use Excel’s auditing tools to trace precedents and dependents. This ongoing validation ensures the accuracy of your financial models.
By implementing financial modeling best practices you can create a model that meets your needs and facilitates better decision-making for your business.
What is the best practice for financial modeling in Excel by the guidelines of colour coding?
Colour coding is a valuable asset in financial modeling if it is applied properly. You can create a visually engaging and easily interpretable financial model that enhances users understanding and decision-making.
Here are some guidelines to effectively use colour coding in your financial models.

1. Consistency is key:
Maintain consistency in your colour scheme to avoid confusion. Give specific colours to categories such as revenues, expenses and net income.
2. Highlight key figures:
Use bold and vibrant colours to draw attention to critical figures or totals.
3. Directional Insights with colour:
Leverage colour to provide directional insights.
4. Conditional Formatting for alerts:
Implement conditional formatting to highlight outliers or values that require attention automatically.
5. Phasing in time-based model:
In models involving time, consider using a gradient of colours to represent different periods.
6. Use of White space:
Balance colour with white space to avoid overwhelming the model. Ensure the background is predominantly neutral.
7. Consider User accessibility:
Be mindful of colour choices for accessibility. Some users may have colour vision deficiencies and choose a colour with sufficient contrast.
8. Documentation and legend:
Include a legend or documentation sheet that explains that explains meaning behind each colour.
Conclusion:
As businesses increasingly rely on data-driven insights proficiency in financial modeling becomes a competitive advantage. Invest in your professional growth, unlock new opportunities and contribute to your organization’s success by enrolling in a financial modeling course today.
If you are an entrepreneur who is looking to fine–tune your business plans or want to enhance your professional career. Enrol in financial modeling courses equips individuals with the skills to construct robust models, forecast future trends and make informed strategic decisions.

Henry Harvin’s Financial Modeling & Valuation Analyst ( FMVA) course Ranked 1st in The Hans India It stands out as a top choice as its premier educational institute offers the best training, practical experience, and exceptional job placement support. Flexible time slots that empower you to learn at your own pace.
Fee:29500/-
Duration:70 hours
Key Highlights:
- Get hands-on 100% practical training to learn about projects
- Integrated curriculum on Financial modeling course
- Gain certification affiliated to MSME and the Government of India
- Placement assistance
- Attend unlimited sessions with multiple trainers.
Recommended Reads
- 10+Best Financial Modeling Courses Online.
- Top 10 BAT Courses in Surat
- 10 Best Financial Modeling Books to Read in 2023
FAQs
Q.1: Why is it important to maintain consistency in Excel formulas throughout financial modeling best practices?
Ans: Consistent formulas enhance model transparency and reduce the risk of errors. When formulas follow a uniform structure, it becomes easier to understand and audit the financial model, ensuring accuracy in calculations and fostering a reliable analysis.
Q.2: How can I effectively organize data in an Excel financial model for clarity?
Ans: Organize data by creating separate sheets for distinct financial statements, balance sheets and cash flow statements to enhance clarity. Labels cells and columns use logical groupings and establish a systematic structure to make the model easily navigable and comprehensible.
Q.3: What roles does a summary or dashboard sheet play in financial modeling best practices?
Ans: A summary or dashboard sheet serves as a snapshot of key metrics, providing a quick overview of the financial model. It helps users understand the model’s insights without delving into the details, fostering effective communication and aiding decision-making processes.
Q4: How can I ensure the accuracy and relevance of my financial model over time?
Ans- Regularly update and review your financial model to reflect changes in data, assumptions or market conditions. Conduct sensitivity analyses and scenario testing to assess the model’s robustness. This ongoing diligence ensures that your financial model remains accurate, relevant and a valuable tool for decision-making.
Q.5: What is the average salary of a candidate certified in a Financial modeling & valuation analyst course (FMVA)?
Ans: The average salary of a candidate with the Financial Modeling and Valuation Analyst (FMVA) certification can vary. Individuals with this certification often earn salaries, with figures ranging from $70,000 to $120,000 or more, depending on their expertise and the specific job role. Keep in mind that these figures are approximate, and actual salaries can vary


